


CHEVRON CORP (NYSE:CVX) Shows Strong Technical Setup for Potential Breakout
Technical analysis investors often look for stocks showing both good momentum and attractive entry points. One method involves finding securities with good technical condition that are also creating consolidation patterns, indicating possible breakout chances. This method uses ChartMill’s Technical Rating, which measures a stock’s trend strength and relative performance, with its Setup Quality Rating, which examines how narrowly a stock has been trading and if defined support and resistance levels exist. A stock with high scores on both measures may offer an interesting risk-reward situation for traders.
Technical Strength Assessment
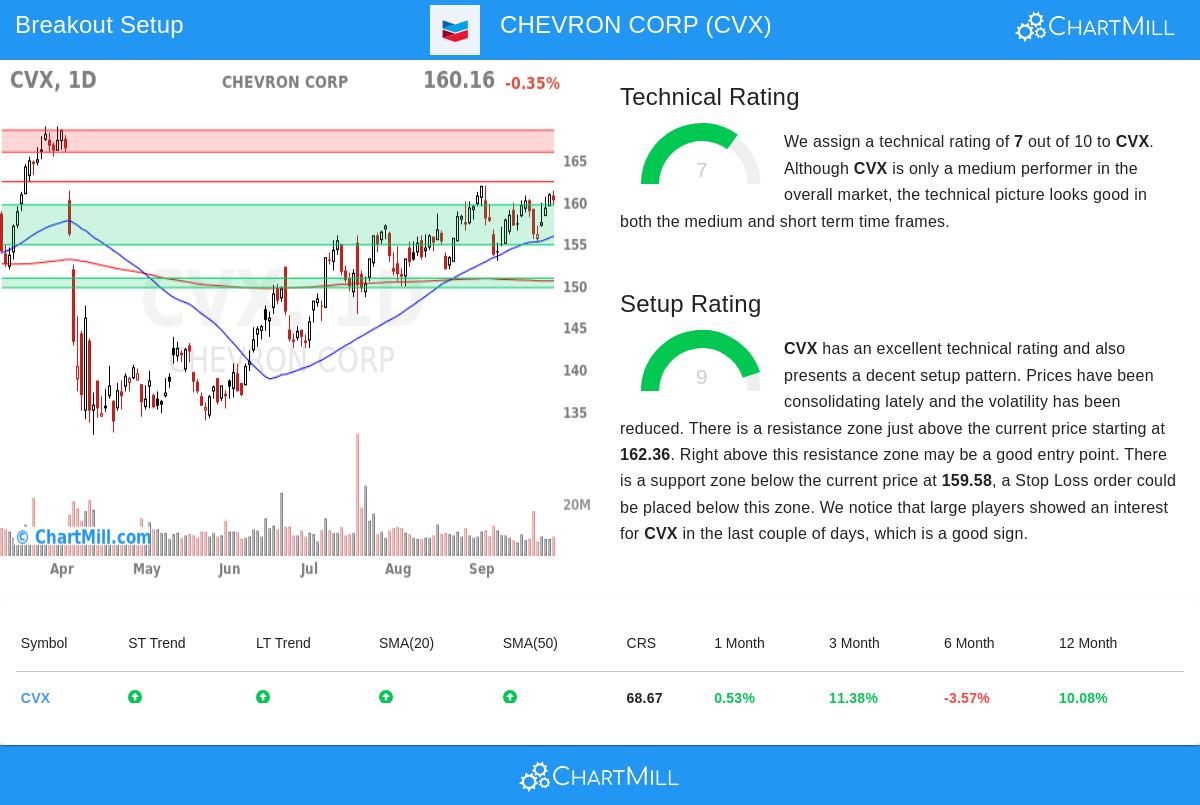
CHEVRON CORP (NYSE:CVX) shows a good technical base, receiving a Technical Rating of 7. This score represents acceptable performance across various periods and fits the strategy’s need for stocks in confirmed uptrends. The technical condition is backed by several main factors described in the detailed technical report:
- Both short-term and long-term trends are rated as positive, showing steady upward momentum
- The stock is trading above its important moving averages (20-day: $157.97, 50-day: $155.83, 100-day: $149.58, 200-day: $150.50)
- Recent performance indicates a 11.38% increase over three months, although six-month performance is still negative at -3.57%
- Relative strength is 68.67, meaning CVX has performed better than 68% of all stocks over the last year
The mix of positive trends across various periods and placement above moving averages gives the technical base needed for breakout methods. Stocks with lower technical ratings frequently do not have the momentum needed for continued breakouts, making CVX’s rating of 7 a good base for more review.
Setup Quality and Consolidation Pattern
Besides technical strength, CVX shows very good setup quality with a Setup Rating of 9. This high score means the stock has been trading in a narrow consolidation range, forming conditions good for a possible breakout. The setup review shows several interesting features:
- The stock has been trading in a small range between $152.88 and $161.86 over the last month
- Four separate support zones are found below the current price, with the closest ranging from $154.80 to $159.58
- Resistance is seen just above current levels at $162.36, with more resistance between $165.89 and $168.52
- Lower volatility and consolidation in recent trading sessions
- Large players have displayed interest in the stock lately, as measured by the Effective Volume indicator
The narrow trading range and defined support/resistance levels create a specific risk situation for technical traders. The closeness to resistance at $162.36 indicates a possible breakout point, while several support levels below offer sensible areas for stop-loss placement.
Trading Implications and Market Context
The mix of CVX’s technical rating of 7 and setup rating of 9 forms an interesting idea for breakout traders. While not in the top group of technical ratings, the stock displays sufficient strength to indicate basic momentum, while the very good setup rating shows it has been gathering energy for a possible move higher. The present market situation, with the S&P 500 displaying positive short-term and long-term trends, gives a supporting background for such setups.
The automated review indicates a possible trade setup with an entry at $162.37 (just above resistance), a stop loss at $155.14, and a risk of about 4.45% on the trade. For traders using a 1% portfolio risk model, this means a position size of about 22.46% of capital. However, these are automated ideas that need personal confirmation based on individual risk tolerance and trading method.
For investors wanting to review similar technical breakout chances, more screening results can be found using the Technical Breakout Setups screener. This tool regularly searches the market for stocks meeting similar standards of good technical ratings combined with high-quality setup patterns.
Disclaimer: This analysis is based on technical indicators and automated screening results for informational purposes only. It does not constitute investment advice, nor does it consider individual financial circumstances, risk tolerance, or investment objectives. Always conduct your own research, consider upcoming earnings releases and news events, and consult with a financial advisor before making any investment decisions. Past performance is not indicative of future results, and all trading involves risk including the potential loss of principal.