


Bitcoin Price Looks Set for Big Gains Toward $138K in ‘Pumptober’
Key takeaways:
-
BTC must clear the next significant resistance level to unlock targets at $127,000–$137,000.
-
On-chain data shows room to run, with $122,000 and $138,000 as the key risk levels.
Bitcoin (BTC) closed September with a 5.35% gain, shaking off a late-month correction. Historically, such green Septembers have set the stage for a bullish “Pumptober,” according to onchain data resource Lookonchain.
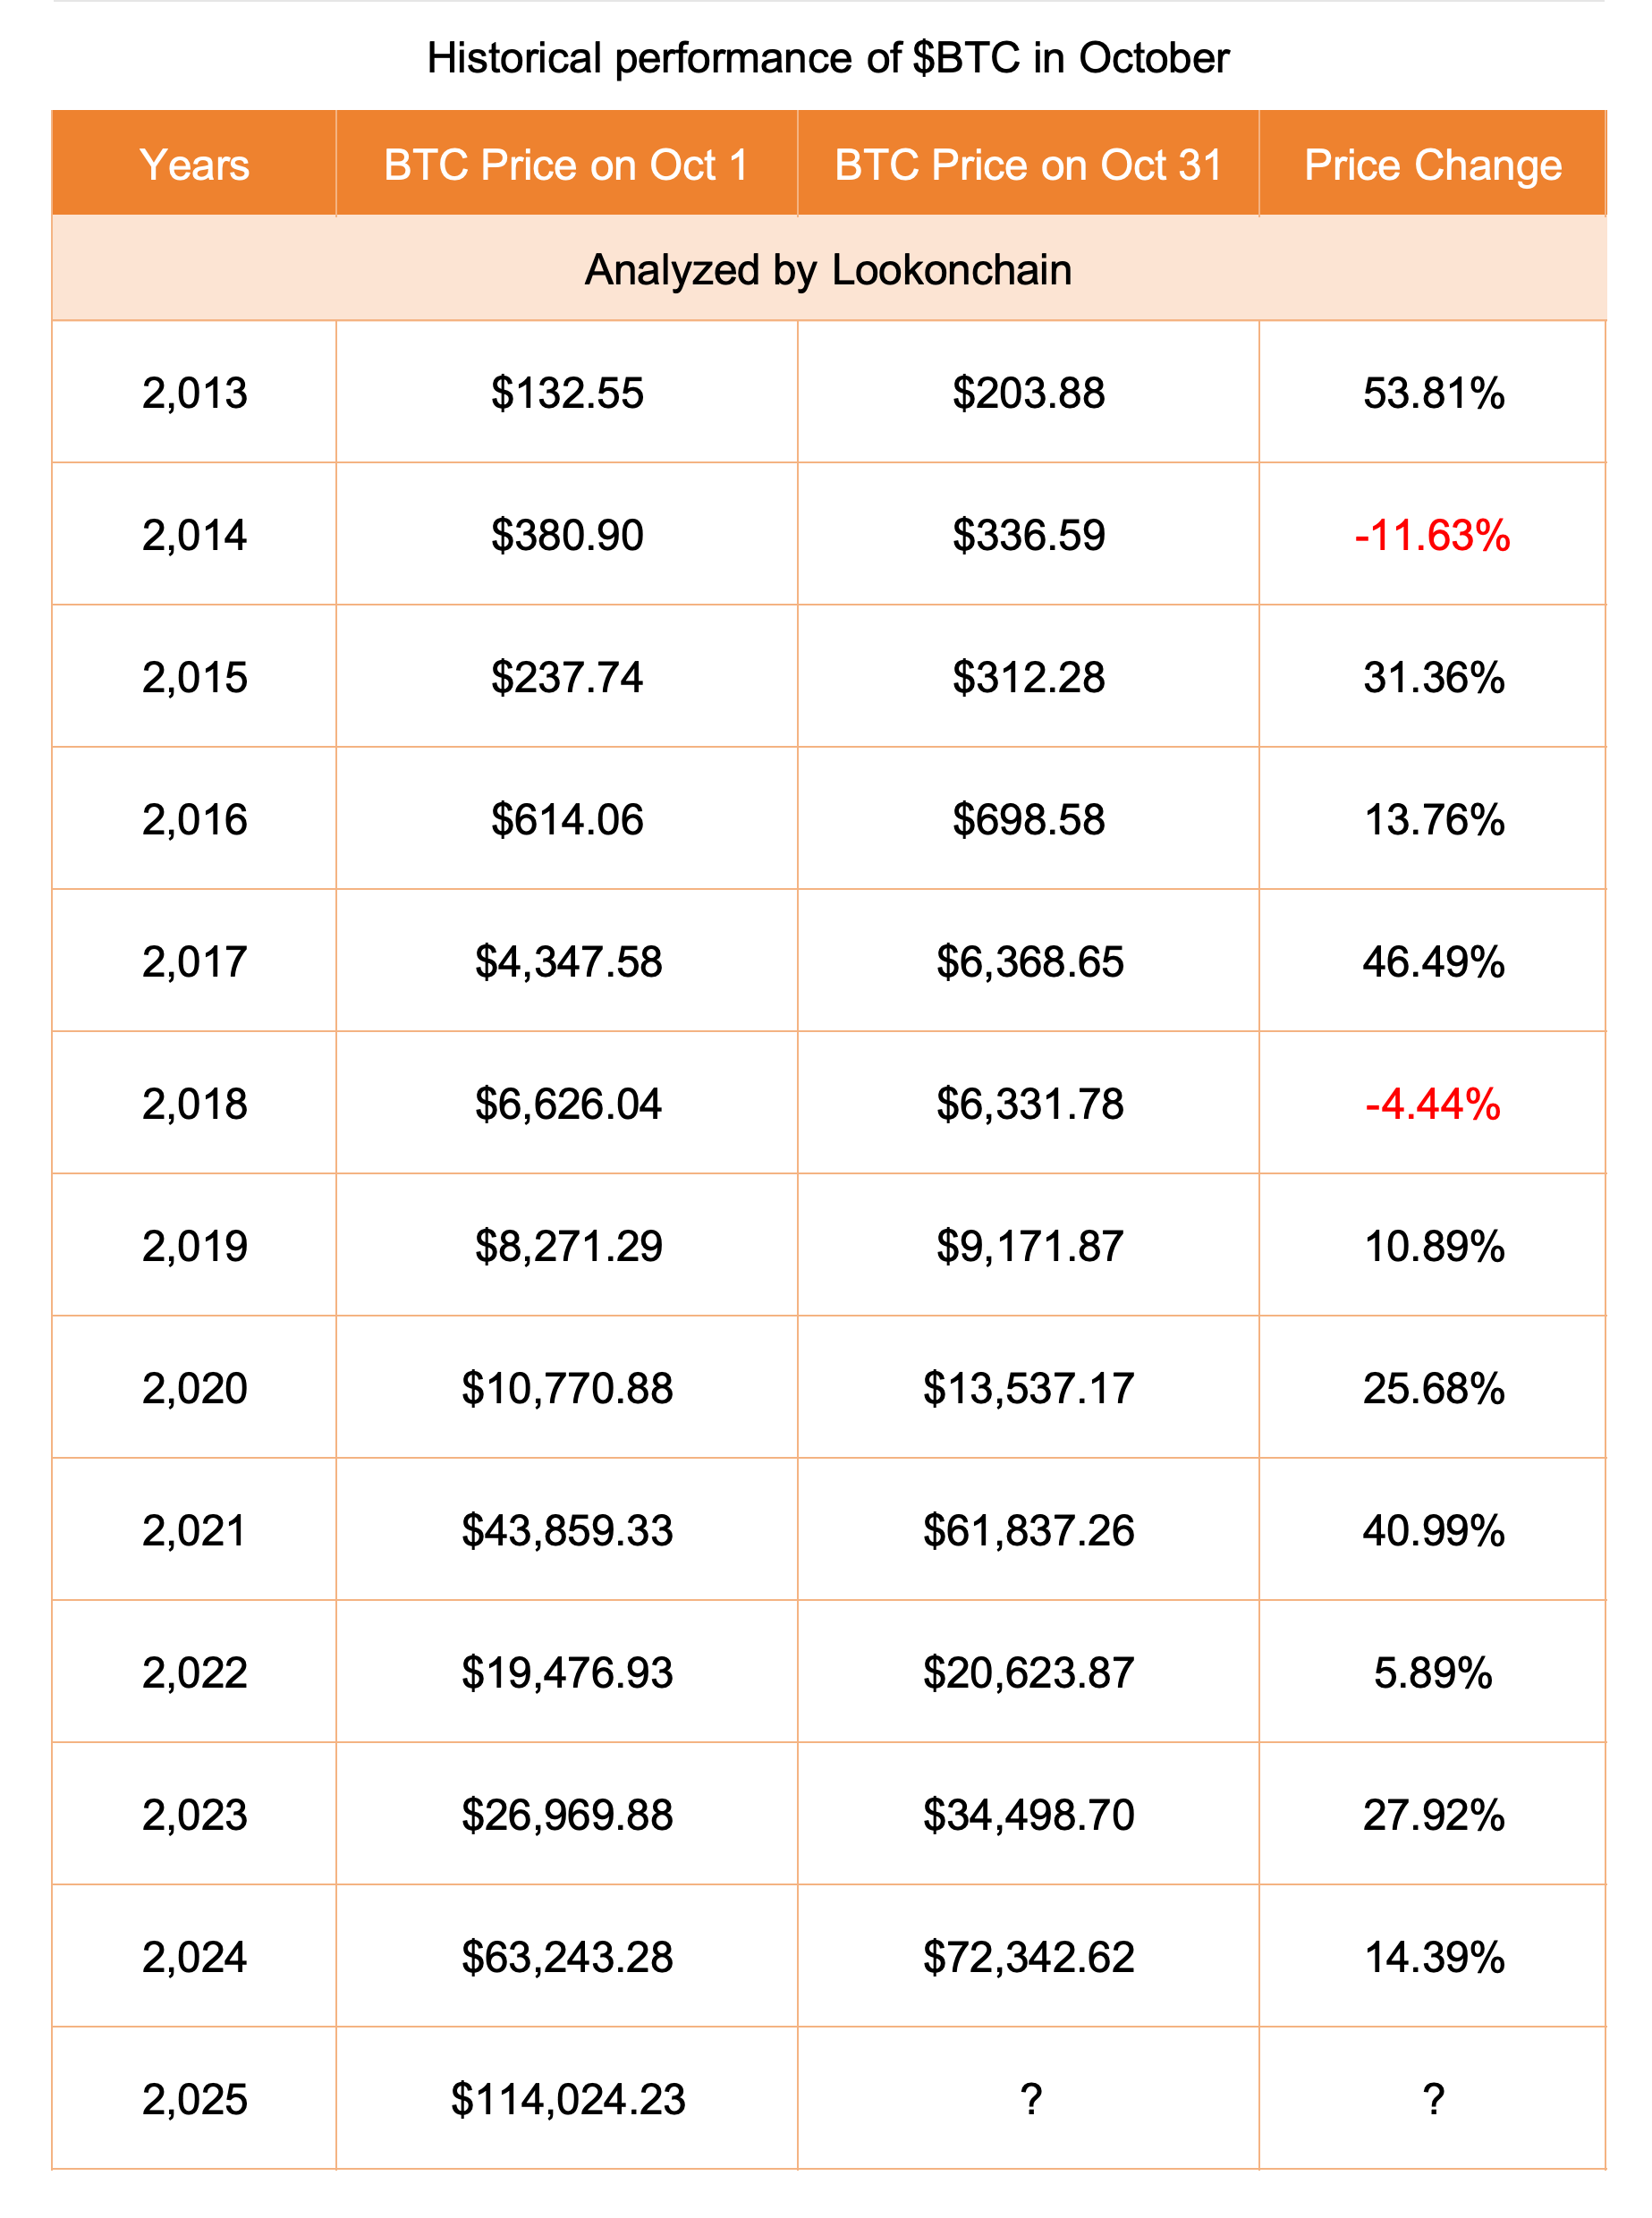
With Bitcoin already up today, will history repeat with massive BTC gains in October once again?
BTC price double bottom targets $127,000
Bitcoin’s daily chart is flashing a classic double bottom setup, a bullish reversal pattern that forms when price bounces twice off a similar support level before breaking higher.
In BTC’s case, the two troughs have appeared near $113,000, with a neckline resistance sitting around $117,300.
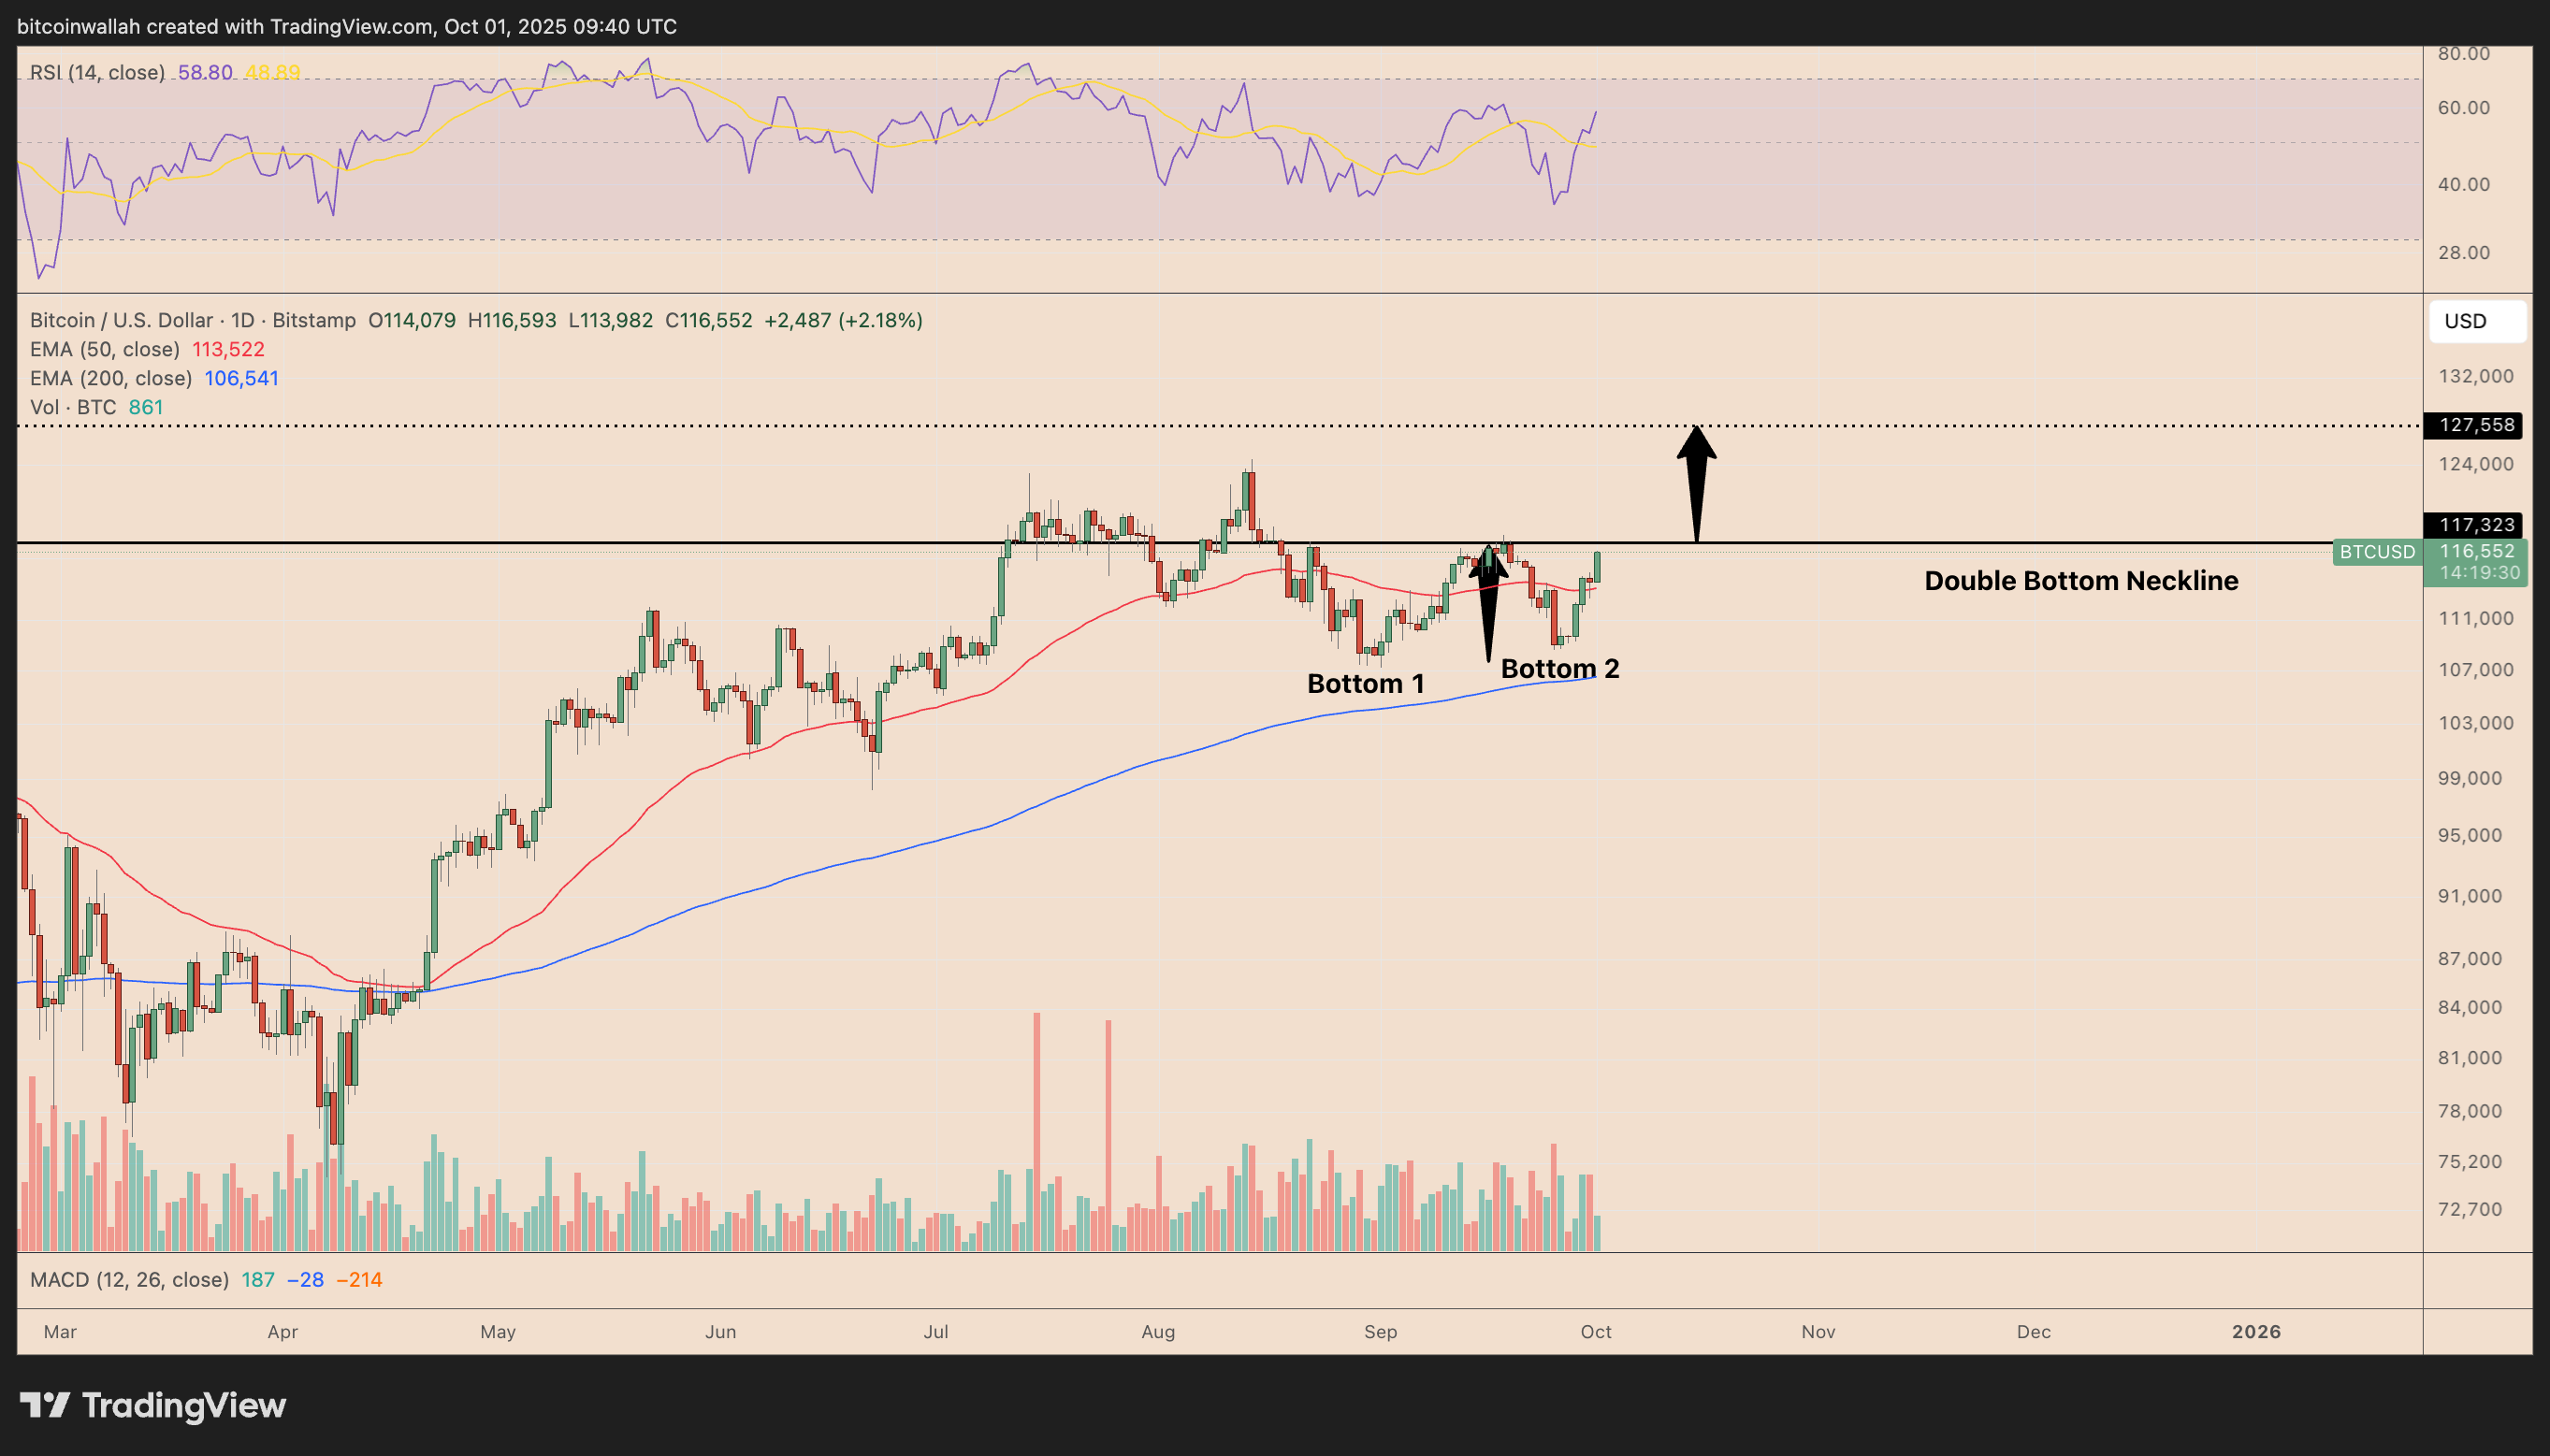
The structure’s technical target points toward roughly $127,500 if bulls manage to push the price decisively above the neckline resistance. That projection is derived by measuring the depth of the pattern and adding it to the breakout level.

Bitcoin’s relative strength index (RSI), meanwhile, has turned higher from neutral territory, suggesting that the bulls are starting to regain momentum.
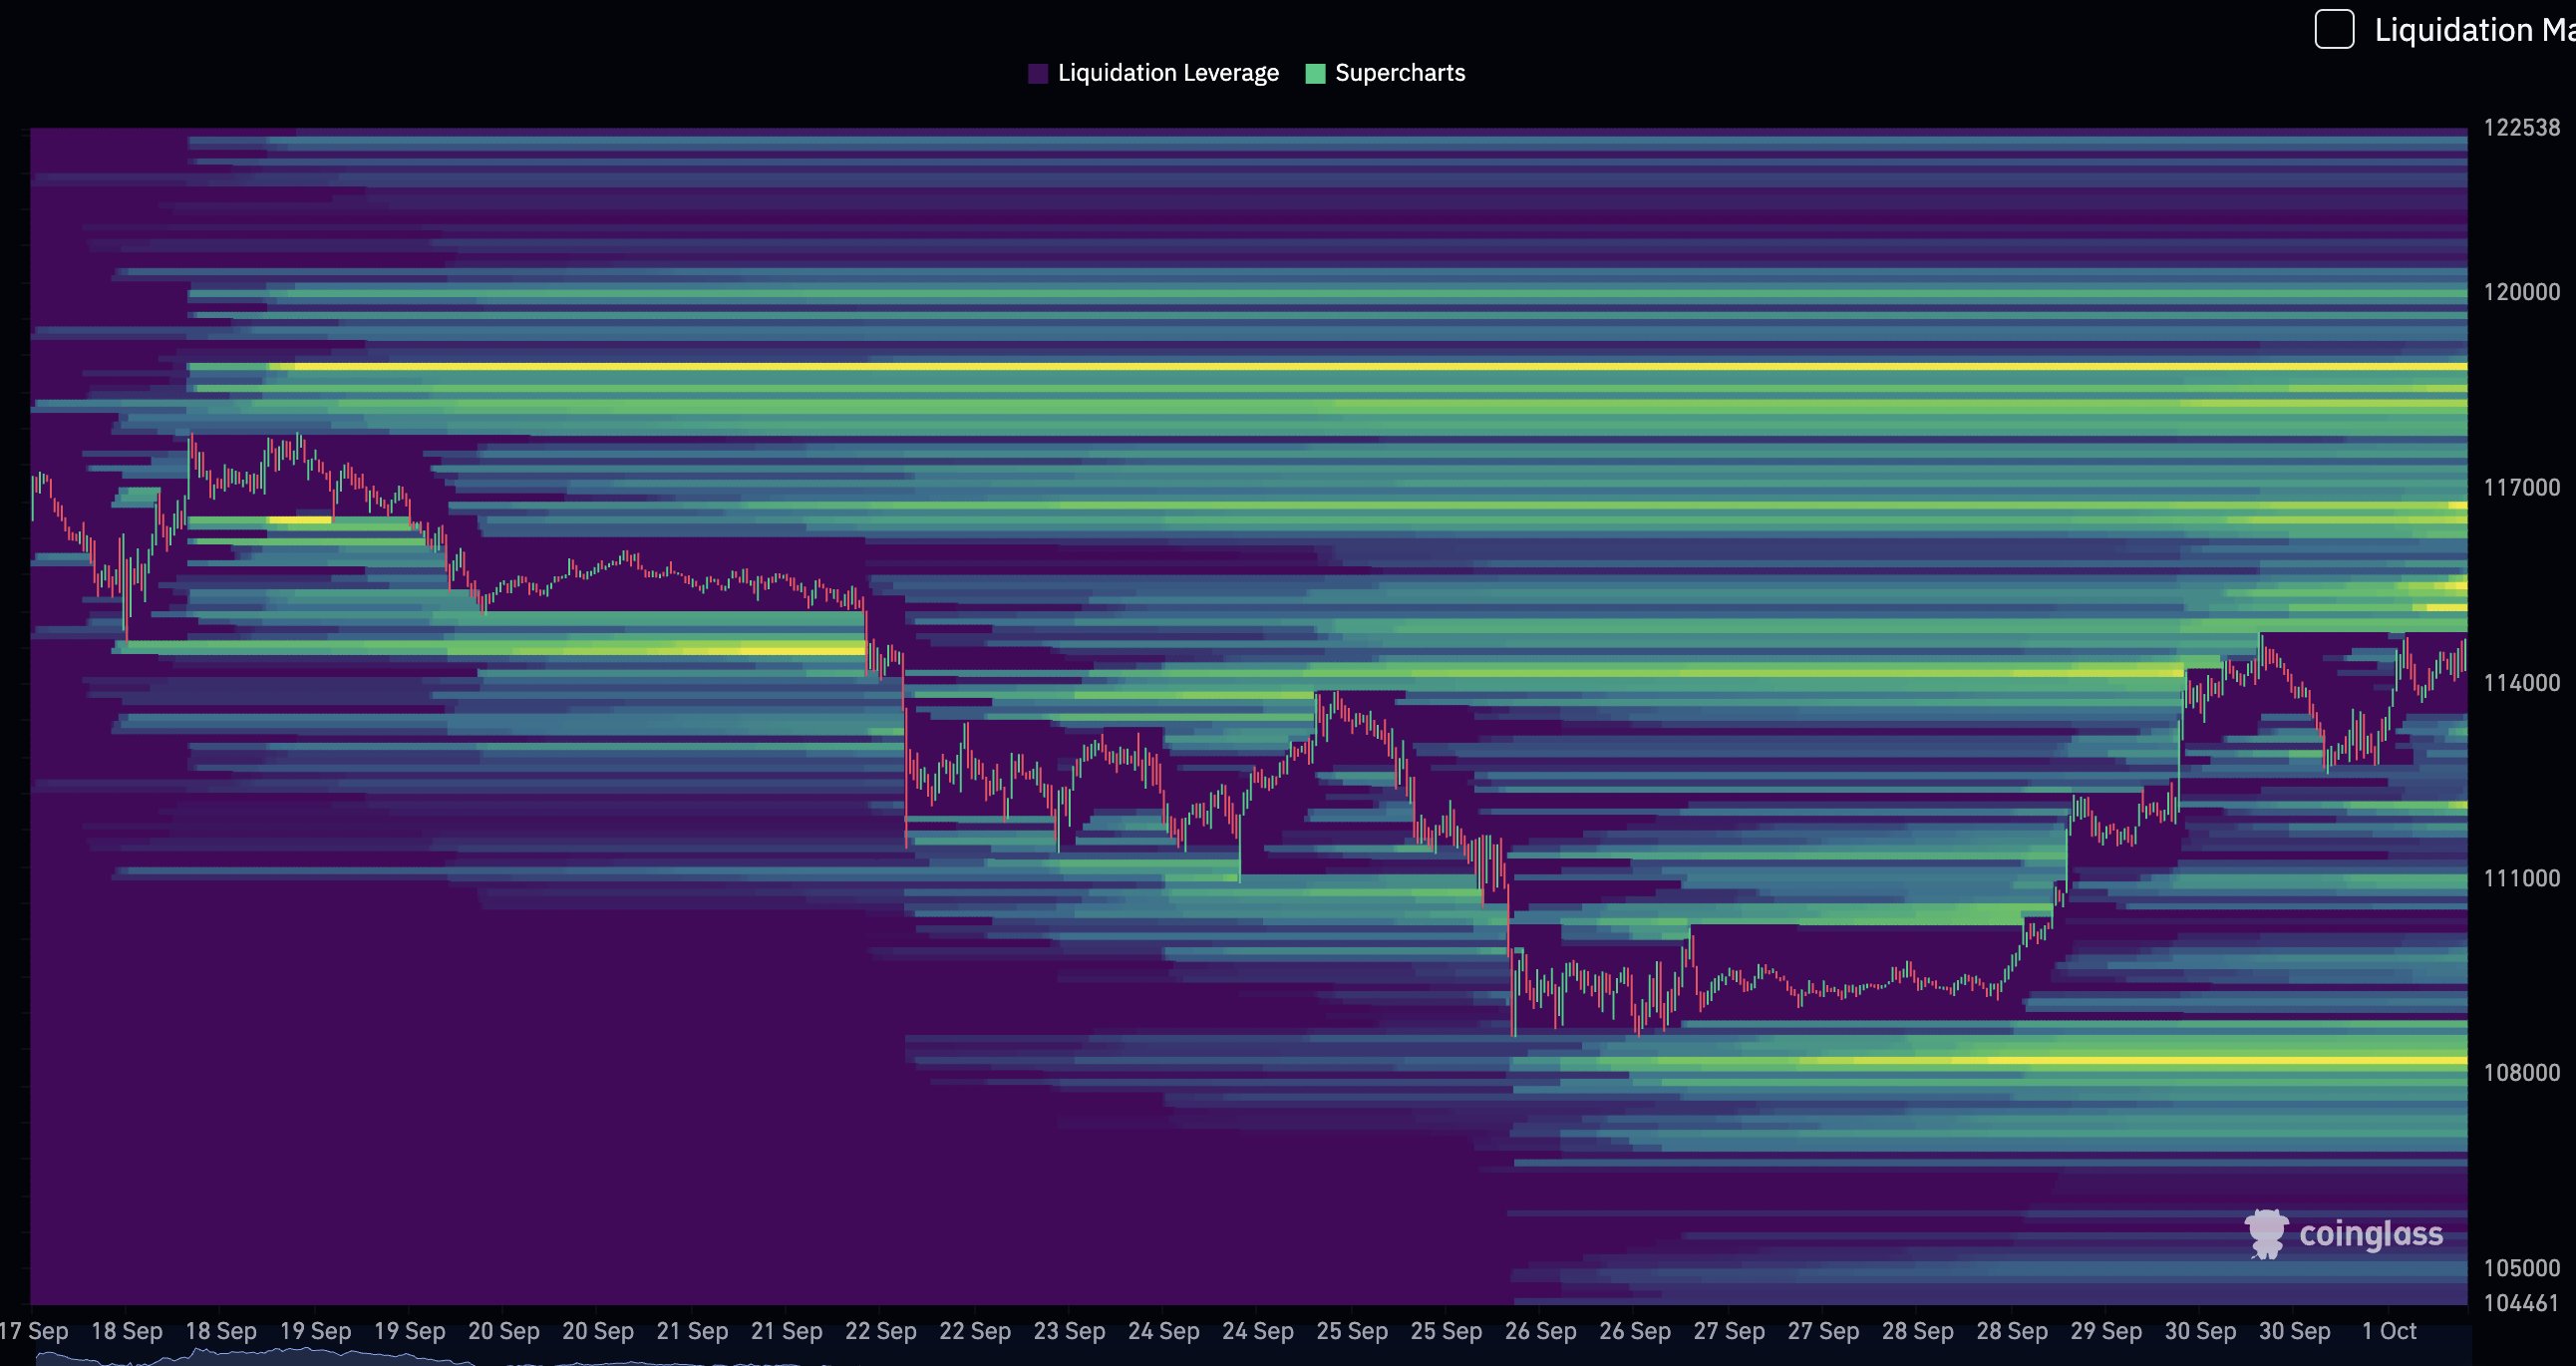
Clearing the $118,000–$119,000 zone, where nearly $8 billion in shorts sit vulnerable, would further validate the breakout and raise the odds of reaching the double-bottom target.
Symmetrical triangle sets Bitcoin up for $137,000
Bitcoin is also trading inside a large symmetrical triangle pattern on the daily chart.
This structure, formed by converging trendlines of lower highs and higher lows, typically precedes a sharp breakout as price compresses toward the apex.
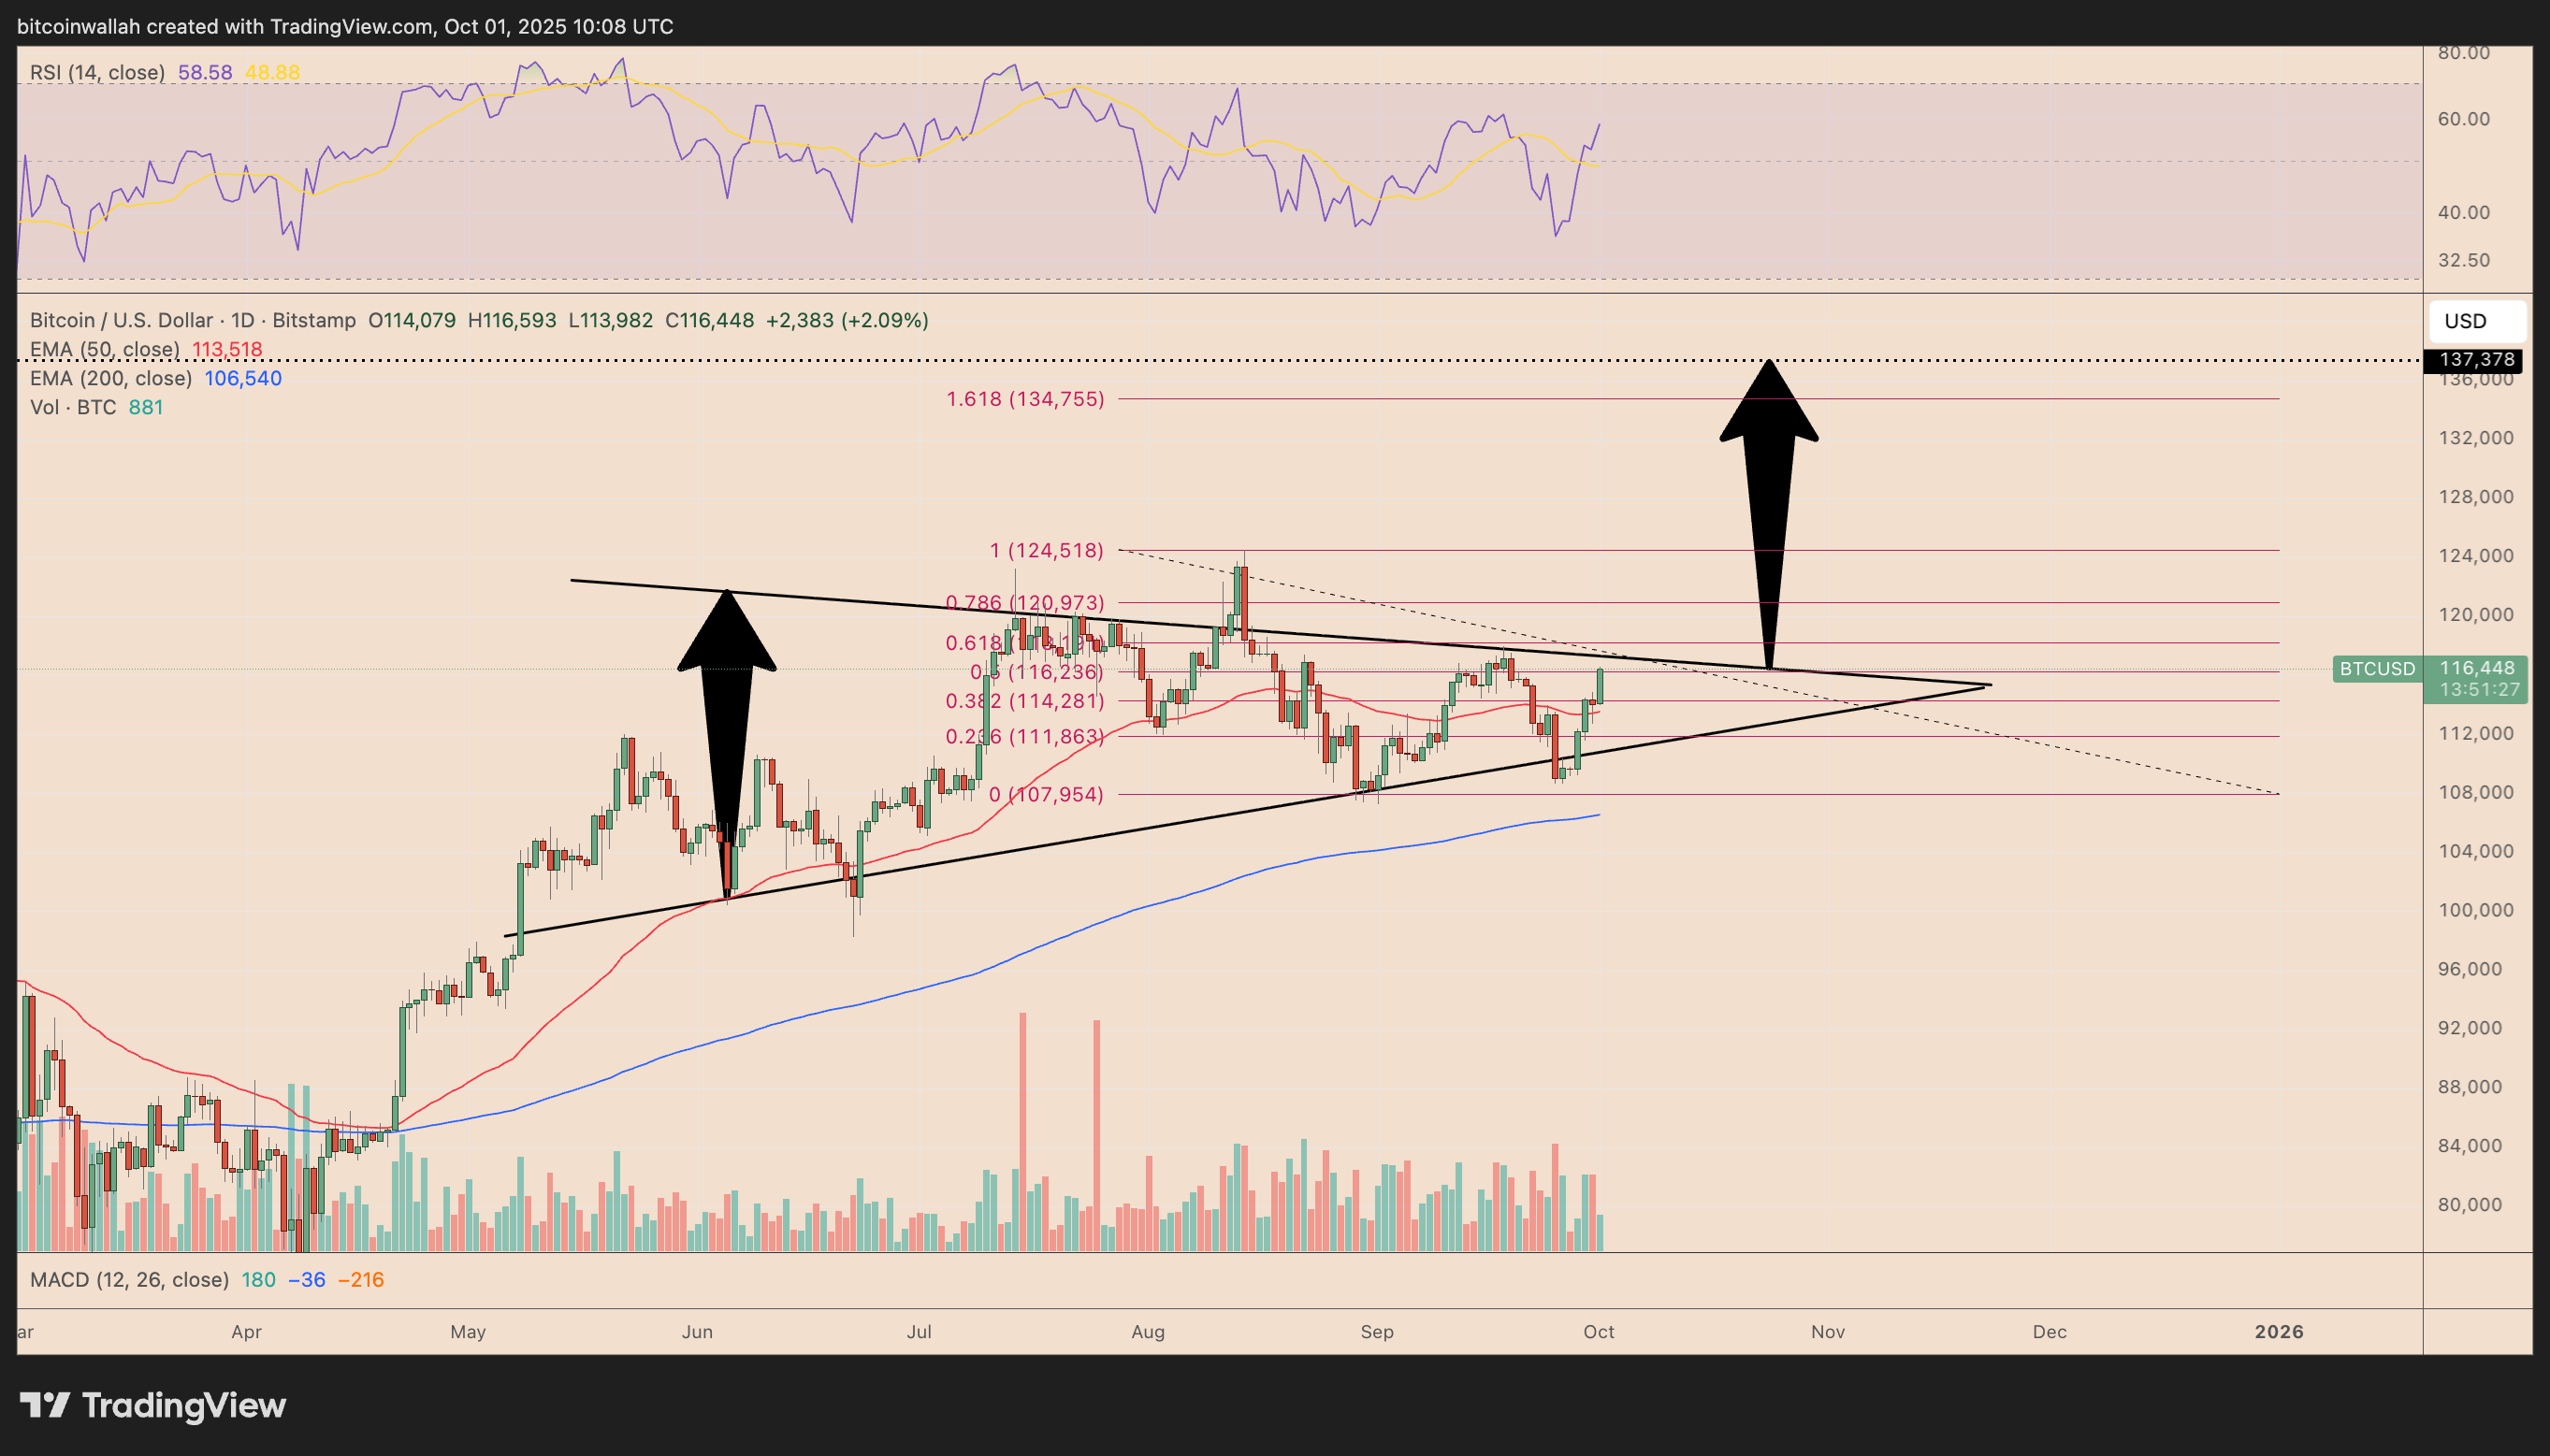
The triangle’s height projects a target near $137,000, up by over 18% from current prices. This target aligns closely with the 1.618 Fibonacci extension level around $134,700.
Onchain data shows BTC has not topped
Bitcoin is still trading below its “heated” risk level, suggesting the rally may have room to extend before short-term traders become overextended.
The cryptocurrency’s Short-Term Holder Cost Basis Model puts the average recent buy price at about $102,900, according to Glassnode data.
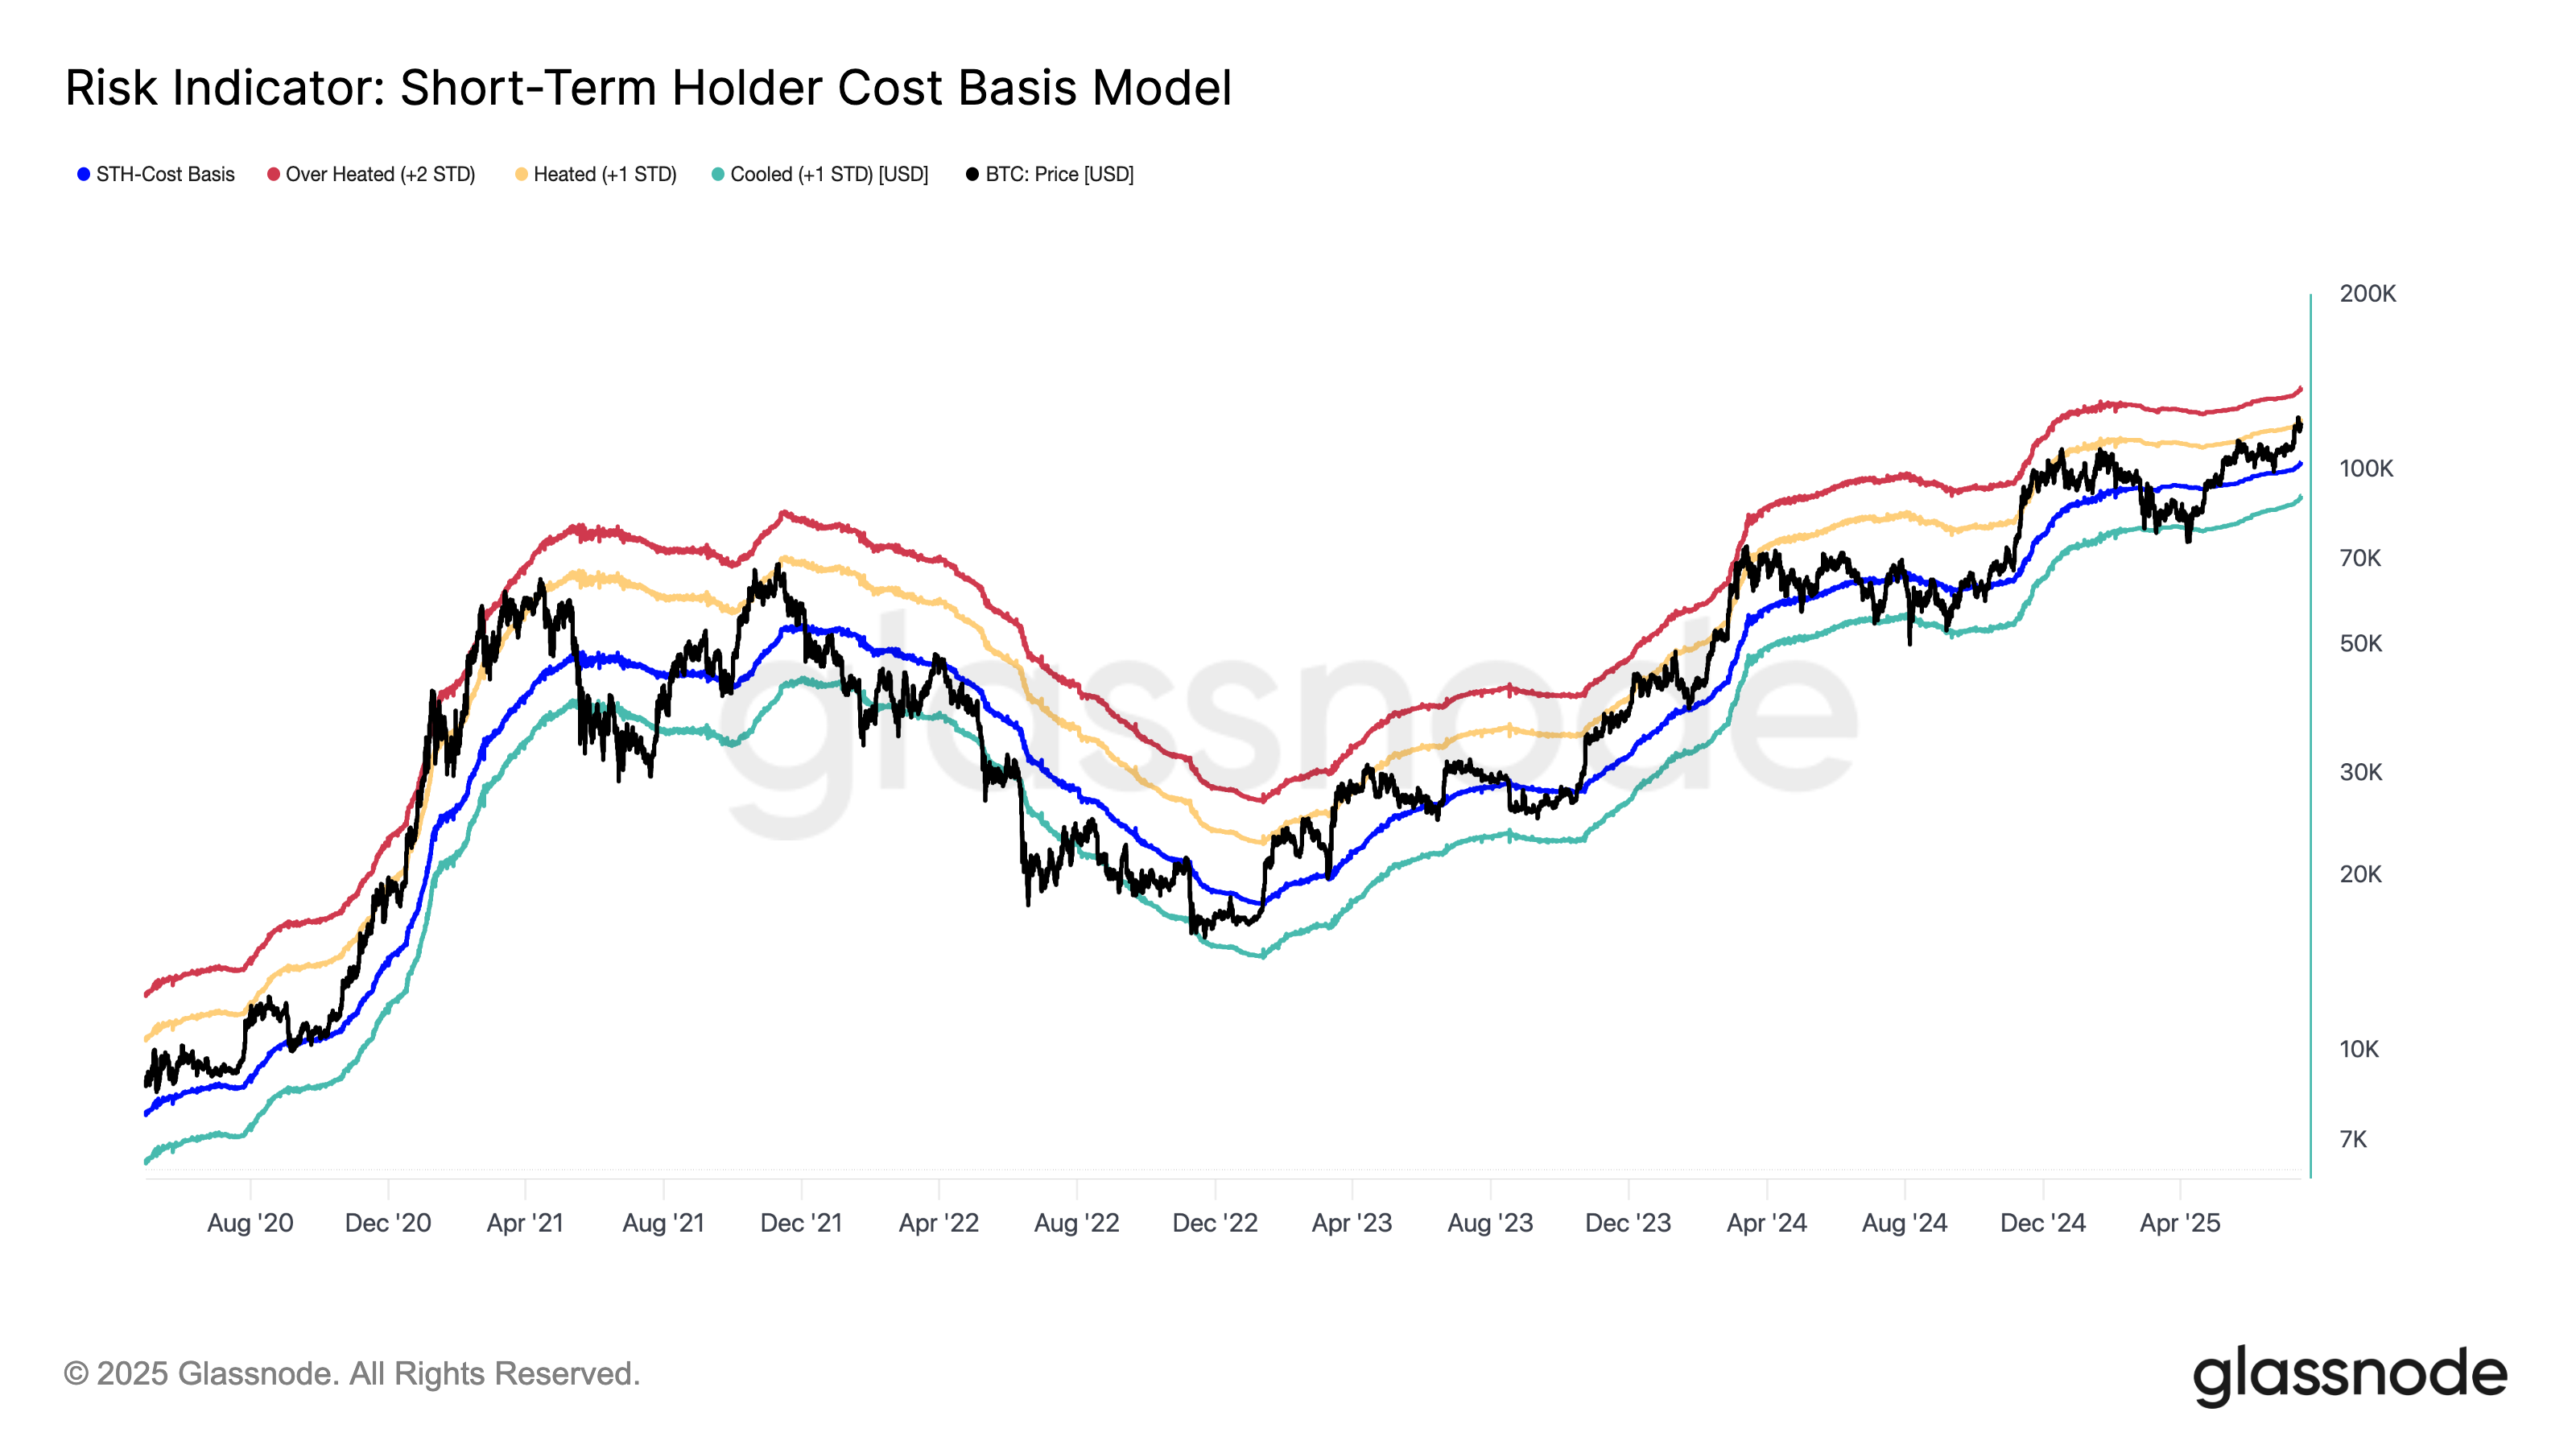
The model flags the heated zone at $122,000 as the first significant threshold and the overheated zone at $138,000 as the level that has often marked cycle peaks in the past.
Related: Bitcoin revives gold correlation as BTC price nears $117K
In other words, if this “Pumptober” rally has legs, then $122,000 is the next near-term test, and $138,000 is a potential ceiling before another possible correction takes place.
This article does not contain investment advice or recommendations. Every investment and trading move involves risk, and readers should conduct their own research when making a decision.