


Watch These Key Bitcoin Metrics as BTC Price Prepares for ‘Big Move’
Key takeaways:
-
The stablecoin SSR RSI signals “buy,” indicating high buying power.
-
Long-term Bitcoin holders have accumulated 298,000 BTC.
-
Bitcoin’s green September close historically precedes Q4 rallies, averaging 78% gains.
Bitcoin (BTC) whipsawed through September, but managed to close the month 5% higher at $114,000 on Tuesday.
Several key indicators now suggest that the recent recovery from $108,000 could signal a “big move” ahead, according to analysts.
Bitcoin’s stablecoin metric signals “buy”
The Stablecoin Supply Ratio (SSR), which measures the buying power of stablecoins relative to Bitcoin, has declined, with its relative strength index (RSI) reaching its lowest in four months.
Related: Pro Bitcoin traders’ view on BTC’s flash crash to $112.6K: Did anything change?
The Bitcoin “SSR RSI is at 21, and is ‘buy’ territory,” said onchain data provider CryptoQuant in part to an X thread on Tuesday.
The last time the RSI was around this level coincided with BTC price bottoming below $75,000, ahead of the 67% rally to the current all-time highs at $124,500.
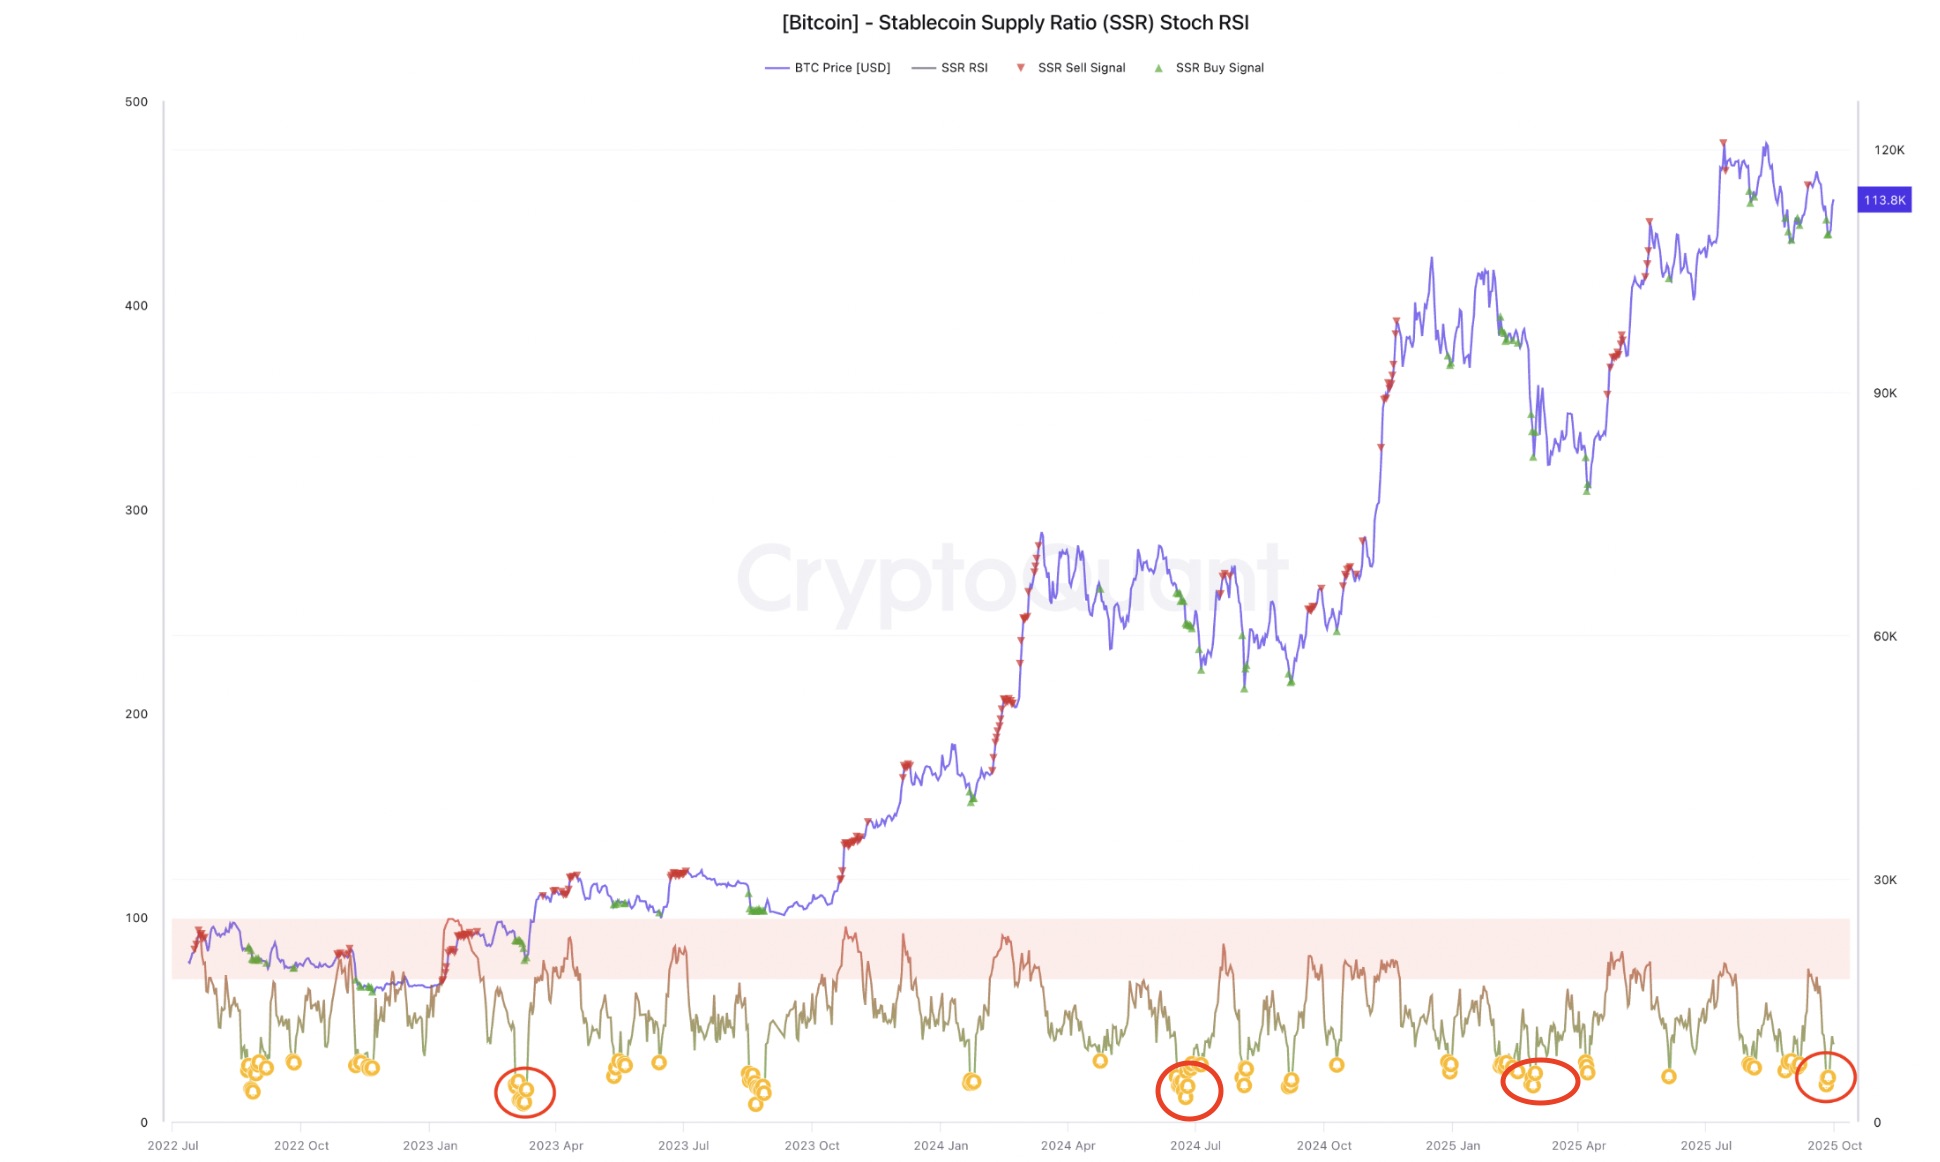
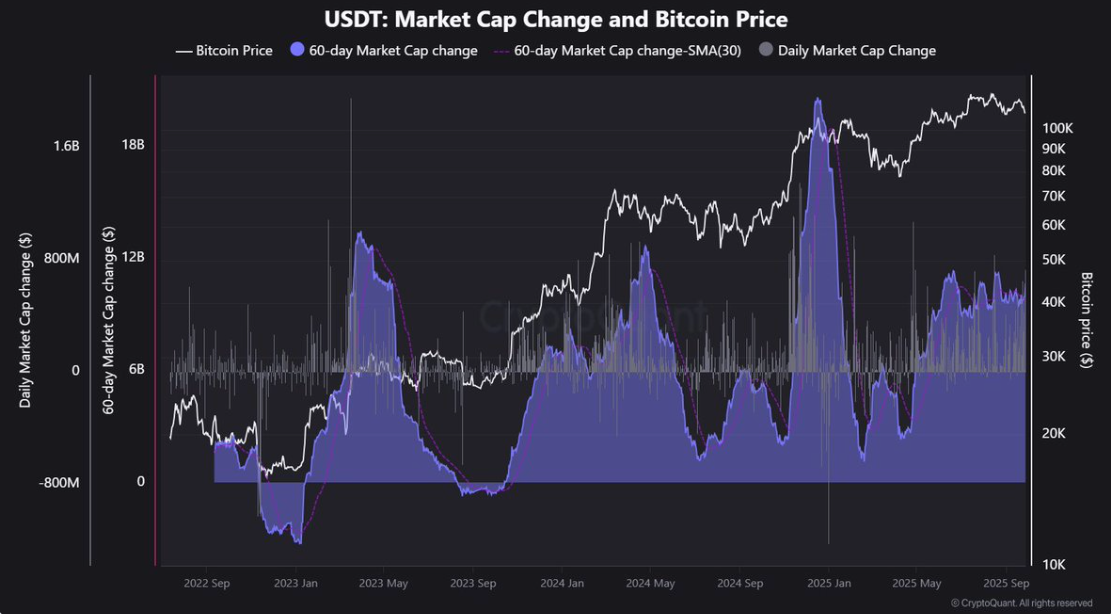
A lower SSR suggests that there is more stablecoin “buying power.” This is reinforced by the ever-expanding stablecoin supply, which signals increased liquidity and investor confidence.
For example, the Tether USDt (USDT) market capitalization has been on a consistent climb, with over 10 billion USDT minted in the last 60 days.
“This is a clear sign of fresh liquidity entering the market,” CryptoQuant noted, adding:
“Rising stablecoin supply is a strong tailwind during bull markets.”
Additionally, Bitcoin long-term holders continue to grow their stash with these accumulation addresses now holding a record 298,000 BTC. This trend suggests that they are optimistic about Bitcoin’s potential to continue rising.
“These signals could shape Bitcoin’s next big move,” CryptoQuant concluded.
BTC price flashes bottom signal
As Cointelegraph reported, several onchain and technical indicators suggest that last week’s drop to $108,650 may have marked the local bottom for BTC.
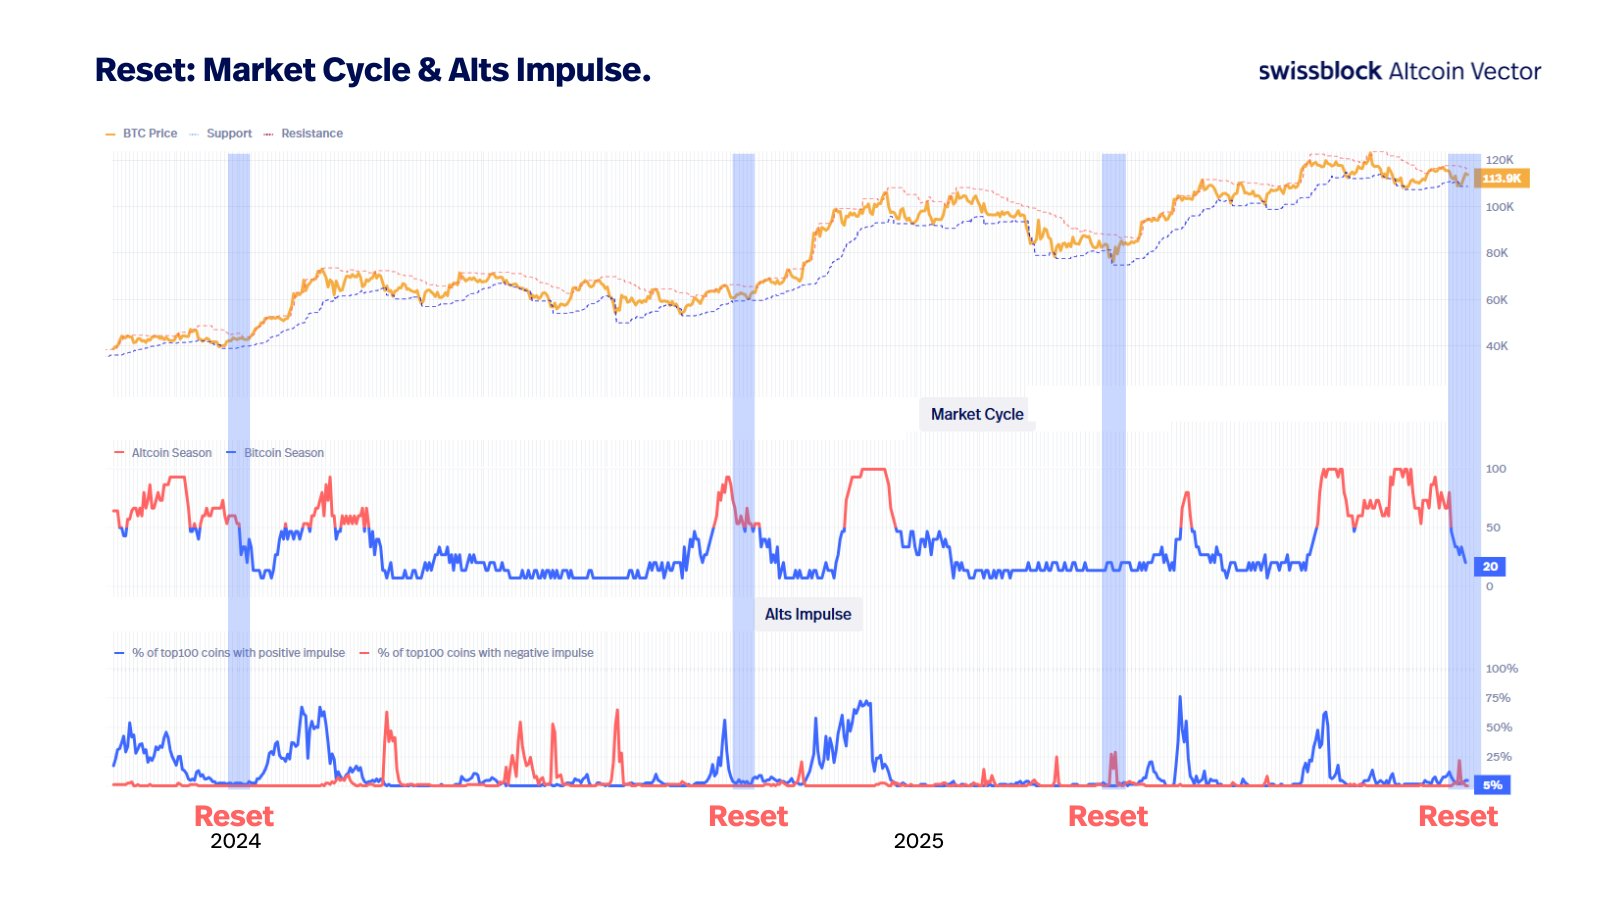
Analytics platform Swissblock also said that the crypto market is resetting based on its aggregated impulse signal, which measures the exponential price structure across the top 350 assets.
The metric has dropped to 20% from over 100% a few weeks ago.
“At that exact point, the Impulse Signal collapses to zero. That’s the moment panic exhausts and new buyers step in,” the company explained.
Swissblock highlighted that this reset has only occurred three times since early 2024, with each instance marking a “cycle bottom” followed by a sustained recovery in Bitcoin’s price.
“We are approaching that setup again.”
Bitcoin avoids “red September” for third year
Bitcoin extended its streak of positive average returns in September, which has historically been known as its worst month or “Rektember.”
September delivers the lowest monthly returns for Bitcoin, which now averages –3% across 13 years from 2013.
However, Tuesday’s close above $114,000 marked a rare bullish end to September, a scenario that has historically been followed by massive gains in Q4 (see figure below).
Popular analyst Mikybull Crypto said in an X post on Wednesday.
“Whenever $BTC closed green in September, what followed in Q4 was usually a massive rally.”
Moreover, the period between October and December is the best quarter for Bitcoin price rallies with average gains of 78%.
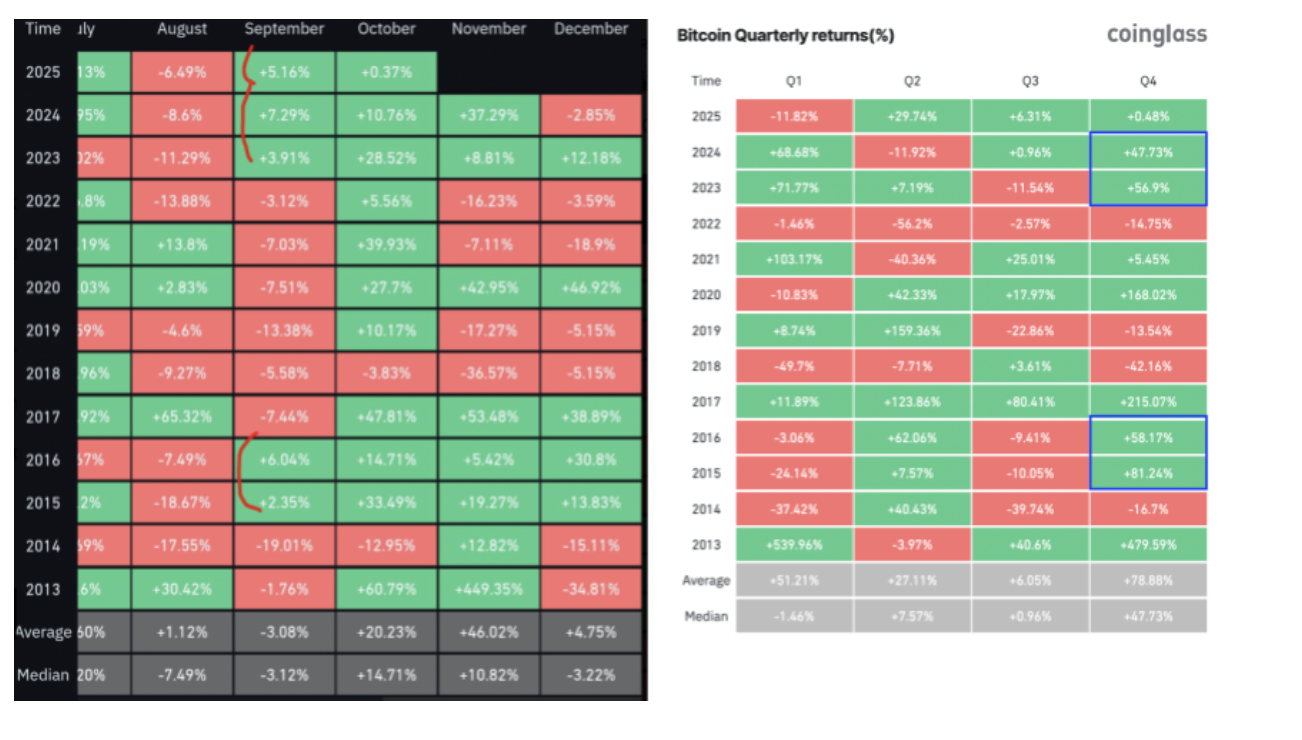
Looking at the recent Q4s, BTC rallied about 48% in 2024 and 57% in 2023 and an exponential gain of 480% in 2013.
If history is anything to go by, BTC price could see its most significant gains of the current bull cycle over the next three months.
This article does not contain investment advice or recommendations. Every investment and trading move involves risk, and readers should conduct their own research when making a decision.