


SQM (NYSE:SQM) Shows Strong Technical Setup for Potential Breakout
For investors using technical analysis methods, identifying stocks showing both strong underlying momentum and good entry points remains a cornerstone of breakout trading strategies. This approach often involves screening for securities that demonstrate good technical health, suggesting a sustainable trend, while also showing signs of price consolidation, which can indicate a potential breakout is near. One such screening process, which filters for a high ChartMill Technical Rating along with a high ChartMill Setup Quality Rating, has recently highlighted Quimica Y Minera Chil-Sp ADR (NYSE:SQM) as a candidate for closer examination.
Technical Strength Assessment
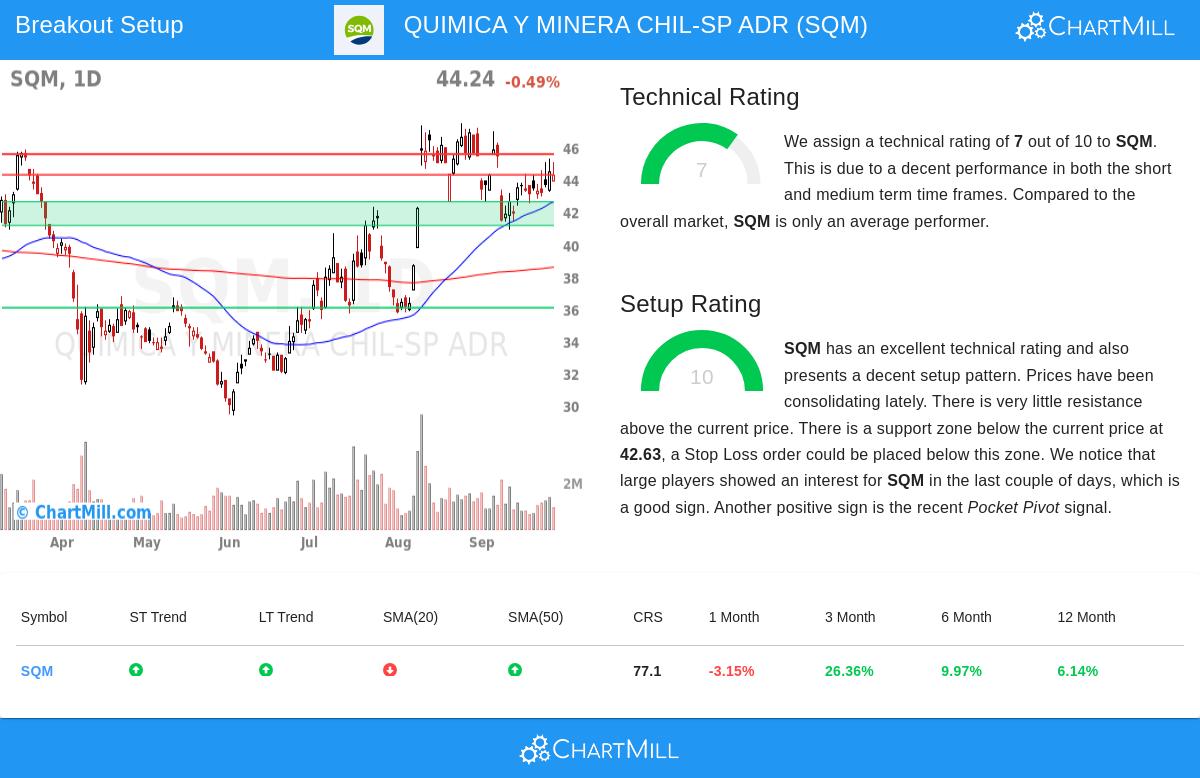
The foundation of a breakout strategy starts with a stock’s technical strength, as a strong trend increases the chance that a breakout will lead to further gains. The ChartMill Technical Rating for SQM is 7 out of 10, indicating a solid technical background. This rating combines multiple factors to measure the stock’s health across different time periods.
A look into the full technical report shows several supportive elements:
- Positive Trend Alignment: Both the short-term and long-term trends for SQM are currently positive. This alignment is a good sign, suggesting buying pressure is present across various timeframes.
- Industry Outperformance: Within the competitive Chemicals industry, SQM is a strong performer, doing better than 82% of its 83 peers. This relative strength is a key part of the technical rating and often points to underlying fundamental or sector-specific positive factors.
- Position Relative to Moving Averages: The stock is trading above its key moving averages (50-day, 100-day, and 200-day), which is a classic feature of a stock in a healthy uptrend. The 50-day and longer-term averages are also rising, supporting the positive momentum.
This combination of factors contributes to a technical profile that suggests SQM is not just having a short-lived bounce but is situated within a broader uptrend, making it a suitable candidate for a breakout strategy focused on trending assets.
Setup Quality and Consolidation Pattern
While a strong trend is needed, it is not enough for an ideal entry. A high-quality setup, indicating a period of consolidation, helps identify a lower-risk entry point. This is where the Setup Quality Rating becomes important, and SQM does well with a perfect score of 10. This score suggests the stock is showing a notable consolidation pattern.
Key observations from the technical report that support this high setup score include:
- Tightened Trading Range: Over the past month, SQM has been trading between $40.90 and $47.19. It is currently positioned in the middle of this range, indicating a period of balance where the forces of supply and demand are equal. Such consolidation after an advance often comes before the next directional move.
- Clear Support and Resistance: The analysis identifies a significant support zone between $41.16 and $42.63, formed by a combination of trendlines and moving averages. Having a well-defined support level below the current price allows for the strategic placement of a stop-loss order to handle risk.
- Supportive Market Activity: The report notes recent interest from large players, as measured by the Effective Volume indicator, and a recent Pocket Pivot signal. These are often seen as signs of accumulation by institutional investors, adding weight to the potential for an upward breakout.
The presence of a consolidation phase with defined support, along with signs of institutional interest, creates a setup where a breakout above near-term resistance could signal the start of a new leg up in the trend.
Trading Implications and Market Context
The combination of a solid technical rating (7) and a very good setup rating (10) places SQM on the radar for technical investors. The proposed automated trading setup from the report suggests an entry point just above resistance at $44.31, with a stop-loss placed below the support zone at $42.38. It is important to note that this is an illustrative example; investors should always do their own analysis to determine entry and exit points that fit their individual risk tolerance.
This technical setup for SQM happens within a broader market environment where the S&P 500 is showing positive trends on both a short-term and long-term basis. A supportive market can provide a positive factor for individual stock breakouts, though it does not ensure success.
For investors interested in finding other stocks that currently meet similar technical and setup criteria, the screening process that identified SQM is repeatable. You can find an updated list of potential breakout candidates by visiting the Technical Breakout Setups screen.
Disclaimer: This article is for informational purposes only and does not constitute investment advice, a recommendation, or an offer or solicitation to buy or sell any securities. The analysis presented is based on technical indicators and should not be the sole basis for making any investment decision. All investing involves risk, including the possible loss of principal. Always conduct your own research and consider consulting with a qualified financial advisor before making any investment decisions.