


Teradyne Inc (NASDAQ:TER) Shows Strong Technicals and High-Quality Setup for Potential Breakout
Technical breakout strategies focus on identifying stocks with strong underlying momentum that are consolidating in preparation for their next significant price move. This approach combines two critical elements: a solid technical foundation indicating the stock is in a sustainable uptrend, and a high-quality setup pattern suggesting the stock is building energy for a potential breakout. By screening for securities that show both characteristics at the same time, investors can pinpoint opportunities where price appreciation seems more likely, assuming the breakout happens as expected.
Technical Strength and Momentum
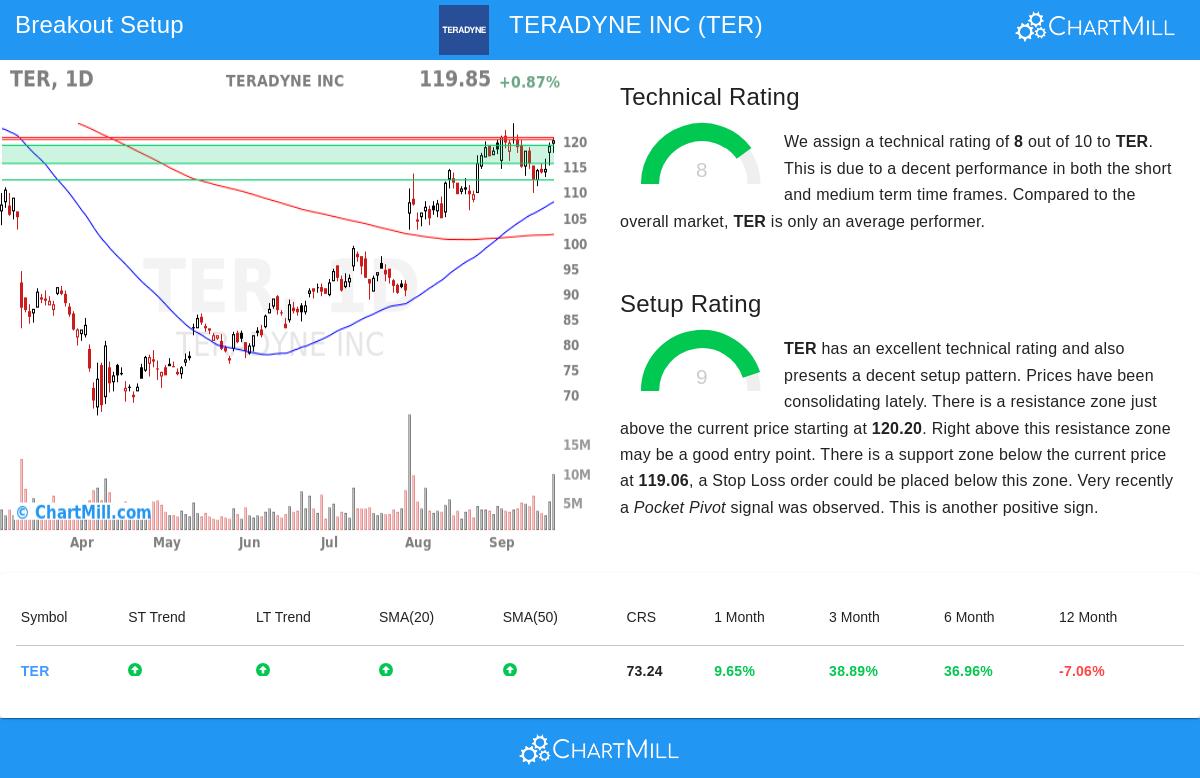
Teradyne Inc (NASDAQ:TER) shows solid technical health, earning a ChartMill Technical Rating of 8 out of 10. This score reflects strength across multiple timeframes and technical indicators, which is important for breakout strategies because it confirms the stock is already in a favorable trend, raising the chance that any breakout will continue in the intended direction. Key factors contributing to this rating include:
- Both long-term and short-term trends are positive, indicating consistent upward momentum.
- The stock is trading above all major moving averages (20-day, 50-day, 100-day, and 200-day SMA), with each average itself in an upward slope, reinforcing trend strength.
- It has done better than 73% of all stocks over the past year, though recent performance has been particularly strong, with gains of about 9.65% over one month and almost 39% over three months.
These elements suggest TER is not just having a temporary bounce but is supported by sustained buying interest and technical strength, making it a candidate worth watching for continuation patterns. For a more detailed analysis, readers can look at the full technical report.
Setup Quality and Consolidation Pattern
Perhaps even more interesting for breakout-oriented investors is TER’s Setup Quality Rating of 9. A high setup score is important because it identifies periods of consolidation where volatility decreases and the stock trades in a narrow range, often forming a base from which it can break out with momentum. TER currently shows several characteristics of a high-quality setup:
- Prices have been consolidating between about $109.56 and $123.44 over the past month, with the current price near the upper end of this range.
- A clear resistance zone exists just above the current price, between $120.20 and $120.61, providing a well-defined level where a breakout could be confirmed.
- Support is established below around $119.06, offering a logical level for a stop-loss order to manage risk.
- A recent Pocket Pivot signal, where price advanced on higher volume than the maximum down volume of the prior 10 days, suggests accumulation by larger players, adding credibility to the setup.
This combination of tight consolidation near resistance, clear support and resistance levels, and bullish volume behavior indicates that TER is building energy and may be set for a breakout if it can move past the $120.20-$120.61 resistance zone.
Market Context and Risk Considerations
While TER shows promising technicals, it is important to note that it is currently trading in the middle of its 52-week range, while the broader S&P 500 is near all-time highs. This suggests TER is behind the overall market, which could be either a cautionary point or an opportunity if the stock catches up. Also, the proposed breakout trade setup suggests an entry above $120.62 and a stop-loss around $115.48, representing a possible risk of about 4.26% on the trade. Investors should think about whether this risk/reward profile fits their strategy and should always be aware of upcoming earnings or sector-specific news that could affect price action.
For investors interested in finding similar technical breakout opportunities, additional screened results are available through the Technical Breakout Setups screener. This tool updates daily and can help find other stocks showing high technical and setup ratings.
Disclaimer: This article is for informational purposes only and does not constitute investment advice. The analysis is based on technical metrics and historical performance, which are not guarantees of future results. Investors should conduct their own research and consider their risk tolerance before making any investment decisions.