


Abbott Laboratories (NYSE:ABT) Presents a Technical Breakout Setup for Investors
Healthcare giant Abbott Laboratories (NYSE:ABT) has been identified as a potential candidate for investors using a technical breakout strategy. This approach focuses on finding stocks that are both technically sound, showing a healthy, established uptrend, and currently trading in a consolidation pattern, which can indicate a possible next upward move. The strategy seeks to answer two key questions: which stock to buy and when to buy it. A stock’s technical condition is measured by its ChartMill Technical Rating, while the quality of its current trading pattern is measured by the ChartMill Setup Quality Rating. Stocks scoring well on both metrics are viewed as leading candidates for breakout moves.
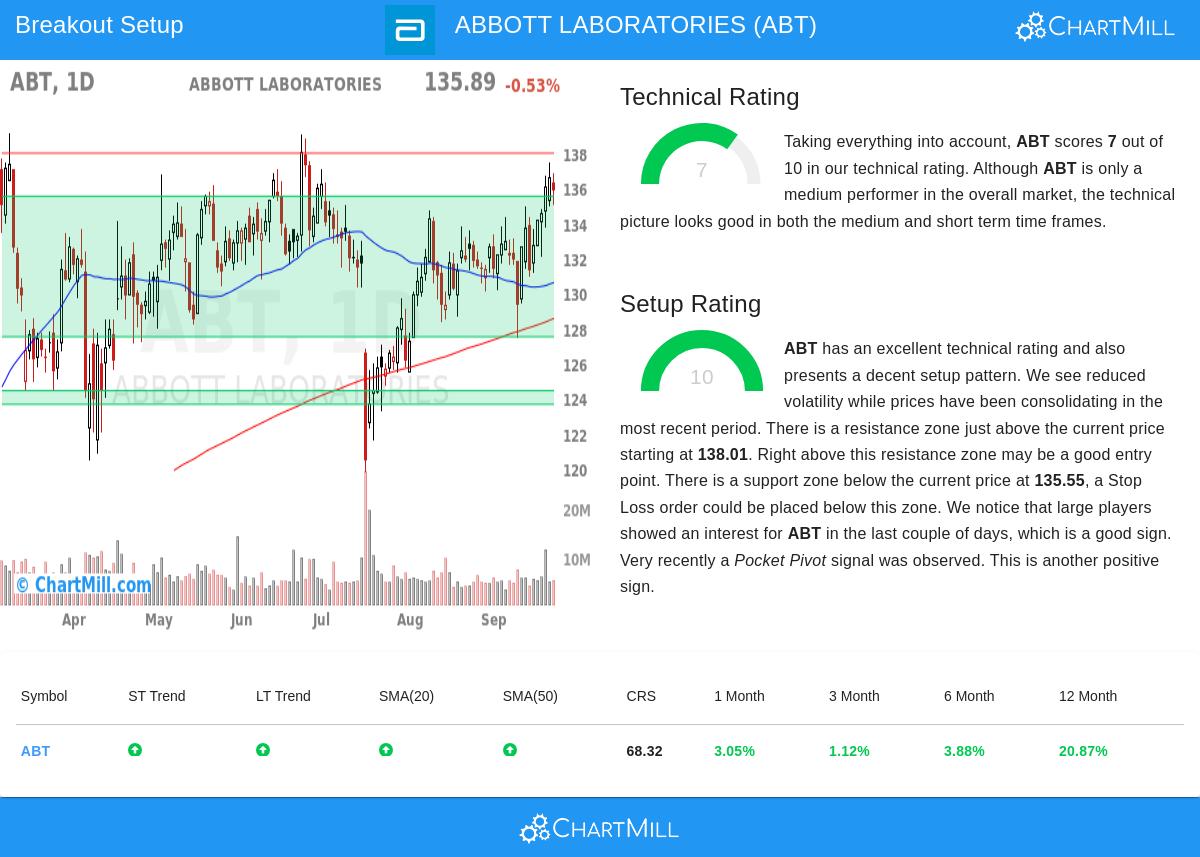
Technical Strength Assessment
A basic part of the breakout strategy is investing in stocks with sound underlying technicals to improve the chance that a breakout will be maintained. Abbott Laboratories shows this strength with a ChartMill Technical Rating of 7, indicating it is in a confirmed uptrend. This rating is supported by several good factors detailed in the full technical report. The analysis confirms that both the short-term and long-term trends for ABT are positive, a good sign for trend-following investors. The stock is also trading above important moving averages, including the 20, 50, 100, and 200-day simple moving averages, all of which are rising. This multi-layered support points to a solid bullish structure.
Key technical highlights include:
- Positive Trend Alignment: Both short-term and long-term trends are positive.
- Strong Industry Standing: ABT performs better than 72% of the other 190 stocks in the Health Care Equipment & Supplies industry.
- Trading Near Highs: The stock is currently trading in the upper part of its 52-week range ($110.86 – $141.23), with a last price of $135.89.
Setup Quality and Consolidation Pattern
While a strong trend is important, a good entry point is key to managing risk. This is where the Setup Quality Rating becomes useful, as it finds periods of consolidation after a price advance. Abbott Laboratories presents a very good setup, earning a perfect score of 10. This high rating shows that the stock has been trading in a tight range recently, which helps set clear risk parameters. Over the past month, ABT has consolidated within a range between about $127.44 and $137.49. This period of lower volatility and sideways movement has formed a base from which a new breakout could begin.
The technical report notes several supportive factors for the setup:
- Defined Support and Resistance: A clear support zone is found between $127.52 and $135.55, giving a logical area for a stop-loss order. Resistance is noted just above the current price, between $138.01 and $140.23.
- Institutional Interest: There are indications that large players have shown interest in ABT recently, as measured by the Effective Volume indicator.
- Pocket Pivot Signal: A recent “Pocket Pivot” signal, a price move up on volume higher than the maximum down volume in the prior 10 days, suggests accumulation.
Trading Implications
The combination of a good technical rating and a high-quality setup indicates ABT could be ready for a move. The automated analysis suggests a possible trading scenario where a buy order is placed just above the resistance zone at $140.24, with a stop-loss order placed below the support zone at $127.43. This structure aims to enter the trade upon confirmation of a breakout while strictly limiting potential losses. It is important to remember that this is an illustrative example; investors should always determine entry and exit points that fit their individual risk tolerance and strategy.
For investors looking for other possible opportunities using this method, new technical breakout setups are found daily. You can find the current list by visiting the Technical Breakout Setups screen.
Disclaimer: This article is for informational purposes only and does not constitute investment advice of any kind. All data and analysis referenced are based on available information and should not be the sole basis for an investment decision. Always conduct your own research and consider consulting with a qualified financial advisor before making any investment.